U.S. Markets Dip Following FOMC No Rate Change Announcement, Amazon Earnings Due Thursday
Although the FOMC announced rates would be kept near zero, all three major U.S. indices closed lower following the conclusion of the two-day Federal Open Market Committee. Fed Chair Jerome Powell met with the press today to announce the no rate change while stressing employment and inflation levels as well as the importance of vaccination rates on the economy. The news of the no rate change typically would support stocks however, after hitting recent record levels U.S. stocks traded moderately lower. Up next is the Biden spending plan which is said to be north of $1.8 trillion dollars and could include tax cuts as well as adjustments.
Also impacting markets is the latest economic reports and earnings, with U.S. trade deficit data releasing info earlier today showing a trade gap in goods climbing over 4% last month. Earnings remain in full swing with Apple, Boeing, and Facebook today- Amazon, Comcast, and Twitter on Thursday. Yesterday, Microsoft and Google earnings supported markets, however, the symbols are trading in opposite directions today with MSFT down nearly 3% while GOOG is up over 3%. Starbucks and AMC Entertainment saw shares lower following underwhelming reports; Boeing dropped over 2.5% as the company reported large losses. Globally, both European and Asian markets closed in the green.
SPY $385-$420 for the next 6 weeks
Our models are projecting the SPY to trade in the range of $385-$420 for the next 6 weeks, following the latest rebound and slowing momentum behind treasury and currency markets. The $SPY has reached our target of $415-$420 based on the 6-month forecast from our Stock Forecast Toolbox and we encourage readers to raise cash at this point. While the DXY sold off and the TLT continues to trade in the range, the SPY broke above the $400 level across all asset classes. We encourage all market commentary readers to maintain clearly defined stop levels for all positions. For reference, the SPY Seasonal Chart is shown below:
Key U.S. Economic Reports/Events This Week:
- FOMC Announcement – Wednesday
- Fed Chair Jerome Powell Press Conference – Wednesday
- Weekly Jobless Claims (4/24) – Thursday
- Gross Domestic Product (Q1) – Thursday
- Pending Home Sales (March) – Thursday
- Personal Income (March) – Friday
- Consumer Spending (March) – Friday
- Core Inflation (March) – Friday
- Consumer Sentiment Index (April) – Friday
Upcoming Earnings:
- AAPL – Apple – Wednesday
- AFL – Aflac – Wednesday
- BA – Boeing – Wednesday
- CAKE – Cheesecake Factory – Wednesday
- EBAY – eBay – Wednesday – Wednesday
- FB – Facebook – Wednesday
- F – Ford – Wednesday
- GRUB – GrubHub – Wednesday
- HUM – Humana – Wednesday
- QCOM – Qualcomm – Wednesday
- SHOP – Shopify – Wednesday
- YUM – Yum Brands – Wednesday
- AMZN – Amazon.com – Thursday
- CAT – Caterpillar – Thursday
- CMCSA – Comcast – Thursday
- KDP – Keurig Dr Pepper – Thursday
- KHC – Kraft Heinz – Thursday
- MA – MasterCard – Thursday
- MCD – McDonald’s – Thursday
- TWTR – Twitter – Thursday
- CVX – Chevron – Friday
- CL – Colgate-Palmolive – Friday
- XOM – Exxon Mobil – Friday
For reference, the S&P 10-Day Forecast is shown below:
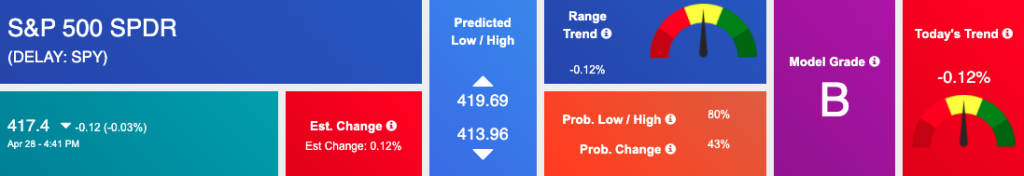
Using the “^GSPC” symbol to analyze the S&P 500 our 10-day prediction window shows a near-term mixed outlook. Prediction data uploaded after the market closes at 6 p.m. CST. Today’s data is based on market signals from the previous trading session.
Vlad’s Portfolio Lifetime Membership!
DO AS I DO… AS I DO IT WATCH LIVE AS I WORK THE MARKETS! TRY IT NOW RISK-FREE!
Click Here to Sign Up
Thursday Morning Featured Symbol
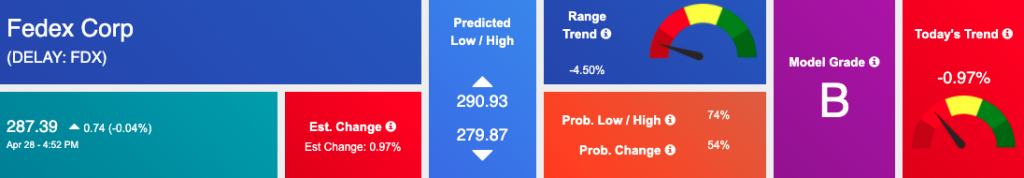
Our featured symbol for Thursday is FedEx Corp (FDX). FDX is showing a steady vector in our Stock Forecast Toolbox’s 10-day forecast.
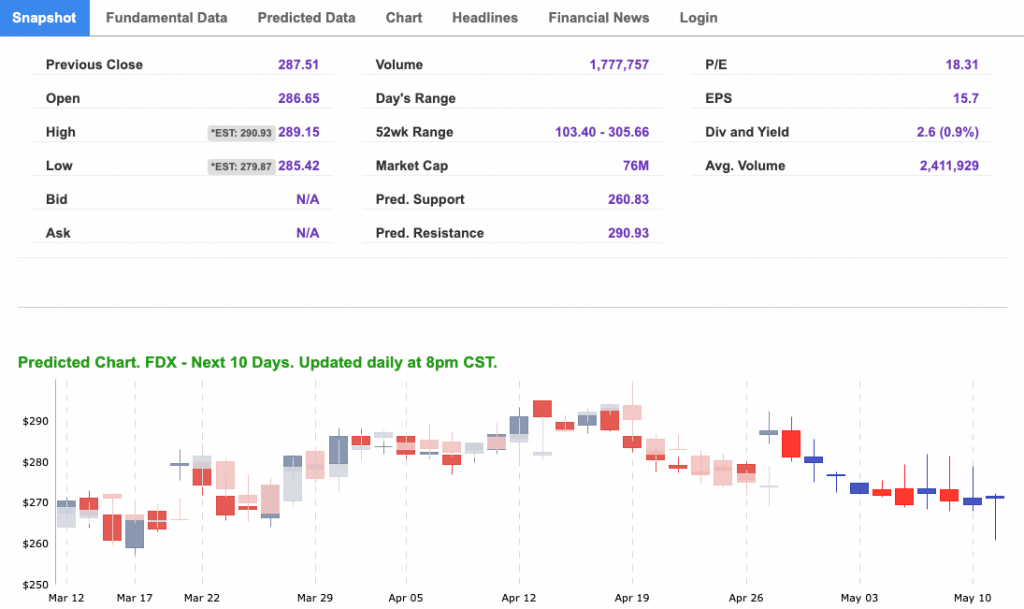
The stock is trading at $287.39 with a vector of -0.97% at the time of publication.
10-Day Prediction data uploaded after the market close at 6 p.m., CST. Today’s data is based on market signals from the previous trading session.
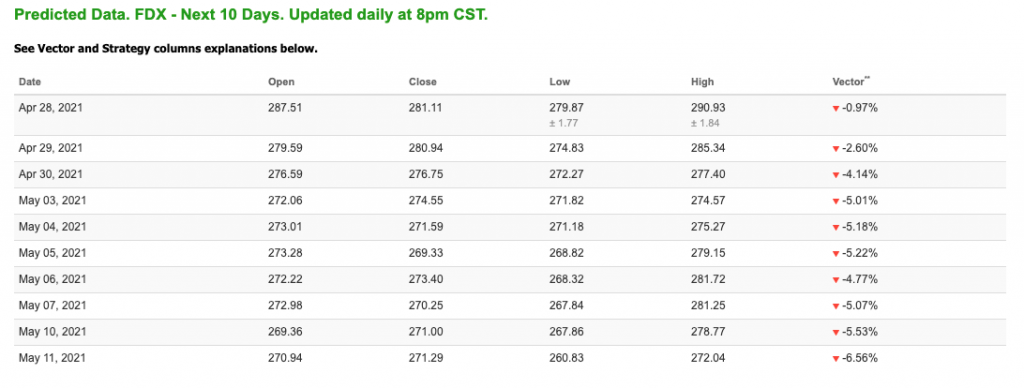
Note: The Vector column calculates the change of the Forecasted Average Price for the next trading session relative to the average of actual prices for the last trading session. The column shows the expected average price movement “Up or Down”, in percent. Trend traders should trade along the predicted direction of the Vector. The higher the value of the Vector the higher its momentum.
*Please note: At the time of publication Vlad Karpel does have a position in the featured symbol, CF. Our featured symbol is part of your free subscription service. Not included in any paid Tradespoon subscription service. Vlad Karpel only trades his money in paid subscription services. If you are a paid subscriber, please review your Premium Member Picks, ActiveTrader, or MonthlyTrader recommendations. If you are interested in receiving Vlad’s picks, please click here.
Oil
West Texas Intermediate for Crude Oil delivery (CL.1) is priced at $63.65 per barrel, up 1.13% at the time of publication.
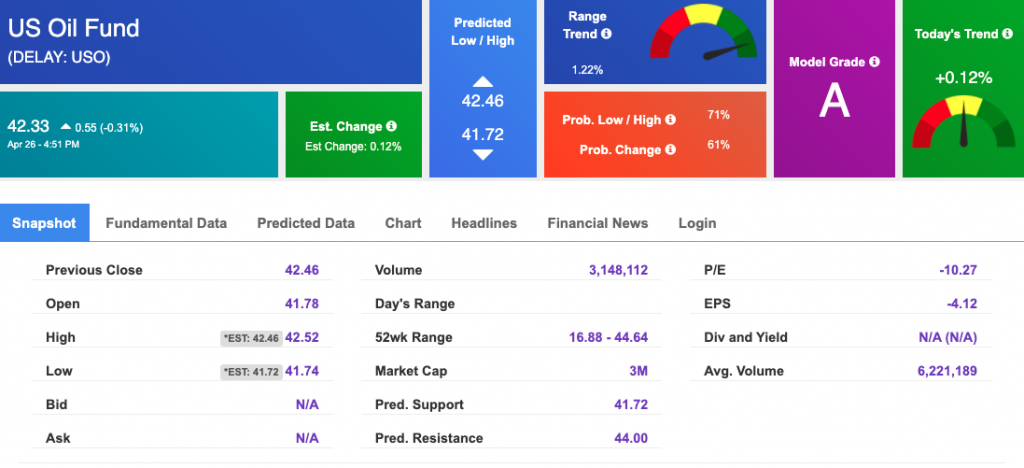
Looking at USO, a crude oil tracker, our 10-day prediction model shows positive signals. The fund is trading at $42.33 at the time of publication. Prediction data uploaded after the market close at 6 p.m., CST. Today’s data is based on market signals from the previous trading session.
Gold
The price for the Gold Continuous Contract (GC00) is up 0.19% at $1781.10 at the time of publication.
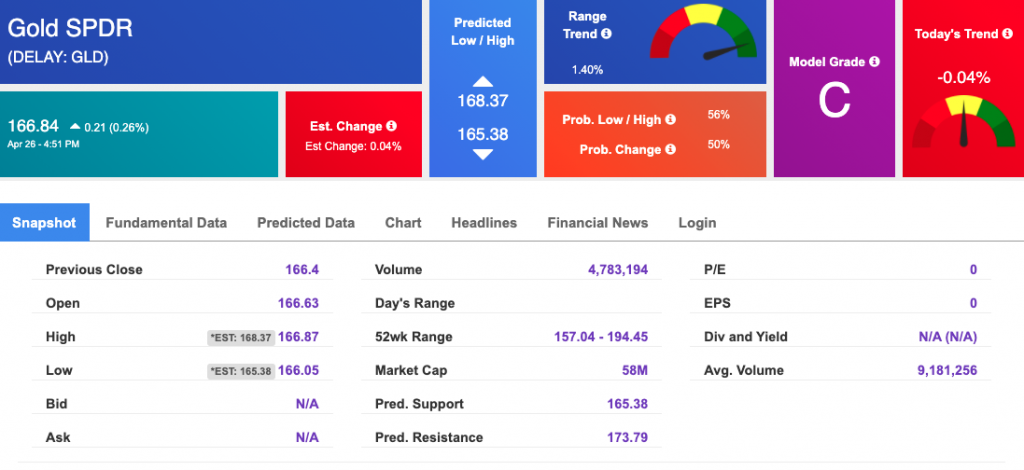
Using SPDR GOLD TRUST (GLD) as a tracker in our Stock Forecast Tool, the 10-day prediction window shows mixed signals. The gold proxy is trading at $166.84 at the time of publication. Vector signals show -0.04% for today. Prediction data uploaded after the market close at 6 p.m., CST. Today’s data is based on market signals from the previous trading session.
Treasuries
The yield on the 10-year Treasury note is up, at 1.603% at the time of publication.
The yield on the 30-year Treasury note is up, at 2.300% at the time of publication.
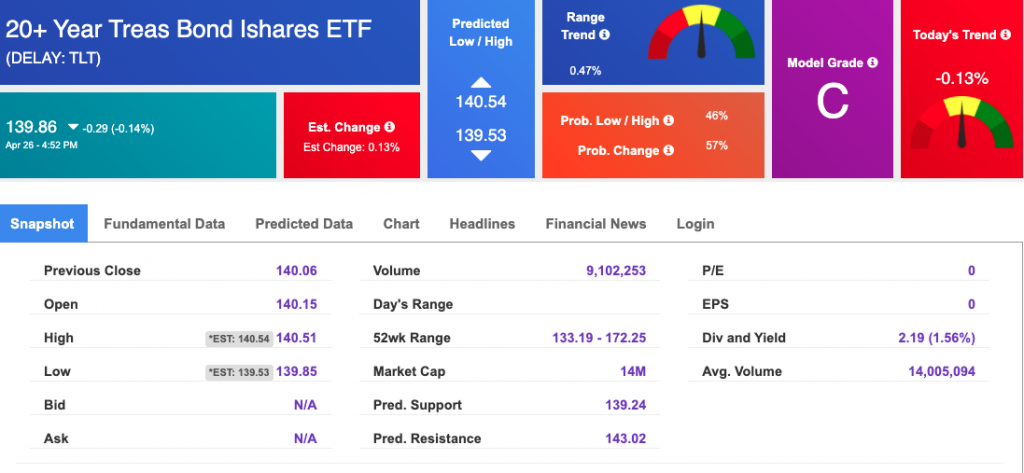
Using the iShares 20+ Year Treasury Bond ETF (TLT) as a proxy for bond prices in our Stock Forecast Tool, we see mixed signals in our 10-day prediction window. Prediction data uploaded after the market close at 6 p.m., CST. Today’s data is based on market signals from the previous trading session.
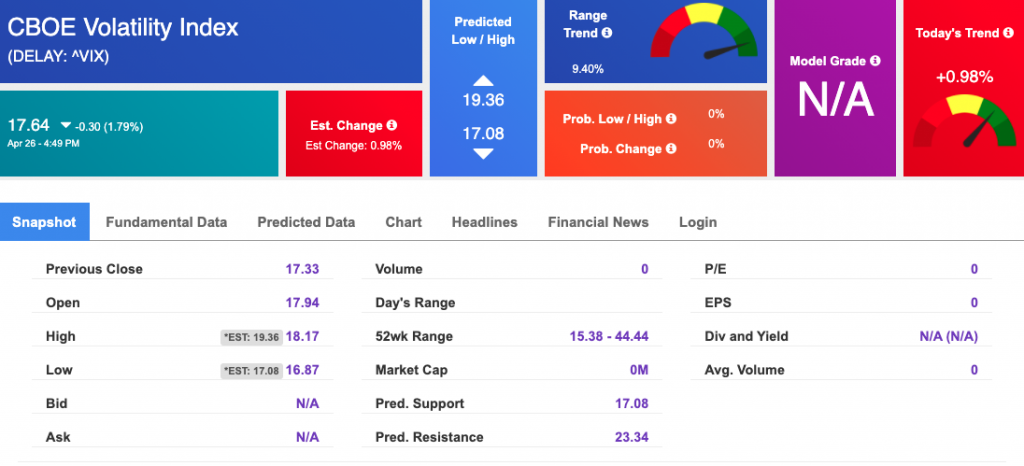
Volatility
The CBOE Volatility Index (^VIX) is $16.91 at the time of publication, and our 10-day prediction window shows negative signals. Prediction data uploaded after the market close at 6 p.m., CST. Today’s data is based on market signals from the previous trading session.