
The Fed Steps Into the Mix as Investors Focus on Economic Outlook
Fed interest rate a “neutral” position for now
All eyes are on Fed interest rates and commentary coming out of a Chicago meeting held yesterday- in which Fed Chairman Jerome Powell indicating a “neutral” position and that he is “open-minded” to questions about providing stimulus to the U.S. economy in the form of rate cuts.
U.S. indeces mixed today
Major indices are seeing mixed trading today after a rally extension from yesterday was attempted. Market sentiments are being tugged in two directions currently, with economic data conflicting with bullish spirits.
Jobs market reports this week
ADP reports for May jobs showed an addition of only 27,000, compared to analyst estimates of 180,000. Investors tend to weigh the official jobs report- pending release on Friday- for a more accurate gauge of the jobs market.
ISM Non-manufacturing PMI stronger than expectations
Data from the Institute for Supply Management’s services-sector index posted stronger than expectations, however, adding a counterweight to the worrisome job numbers.
Trade disputes make impact on the market
Another present factor pushing markets today is the ongoing trade disputes from Washington.
(Want free training resources? Check our our training section for videos and tips!)
Tariffs on Mexican imports almost sure thing
The Trump administration again doubled down on threats to install escalating tariffs on Mexican imports in an attempt to force the southern trading partner to crack down on Central American migrant flows into the U.S.
Not all Republicans agree with tariffs on Mexico
Republican senators are reportedly not on board with this move and there are internal conflicts as to where this threat will lead. Pete Navaro, a White House trade advisor, made it known in a CNN interview Wednesday morning that the Mexico tariffs may not need to go into effect ultimately.
Rare-earth mineral exports ban retaliation from China
China has revisited its threats to restrict rare-earth mineral exports which are an integral part to the manufacturing of high-tech devices in a move to combat U.S. tariffs.
U.S.-China meeting at the G-20 meeting
Looking ahead, we will see U.S. Treasury Secretary Steven Mnuchin meeting with Yi Gang, Governor of the People’s Bank of China, at a G-20 meeting in Japan this weekend.
Any meeting a positive event
Any instances of face-to-face meetings of high-level officials on both sides will be taken as a positive event in the overall situation.
(Want free training resources? Check our our training section for videos and tips!)
Beige Book release today
The Fed is releasing the Beige Book today at 2 p.m. EST- a much deeper, granular set of reports on economic data that is likely to be absorbed by investors looking at gauges for economic vitals.
Apple, UnitedHealth, GameStop, SalesForece and Campbell Soup in focus today
Stocks in focus today include Apple Inc., (APPL), UnitedHealth Group Inc. (UNH), GameStop Corp. (GME), SalesForece.com Inc (CRM) and Campbell Soup Co. (CPG).
Apple shares up 2.3% after Tim Cook interview
Apple CEO Tim Cook asserted in a CBS News interview on Wednesday that the tech giant is not a monopoly- in response to a broad antitrust law probe into large technology companies. Shares climbed 2.3% in early trading.
UnitedHealth Group raise its quarterly dividend by 20%
UnitedHealth Group will be raising its quarterly dividend by 20% to $1.08 per share, it said on Wednesday as the stock rose 1.2%.
GameStop is eliminating its dividend
GameStop shares are down 38.55% at the time of publication, following disappointing Q1 earnings and news that it is eliminating its dividend.
Salesforce posted a first-quarter earnings beat, shares up 3.4%
Salesforce posted a first-quarter earnings beat Tuesday evening, and shares saw a 3.4% jump in Wednesday trading.
Campbell Soup Co. shares jump 9.26%
Campbell Soup Co. posted fiscal third-quarter earnings that topped expectations, with shares trading up 9.26% at the time of publication.
(Want free training resources? Check our our training section for videos and tips!)
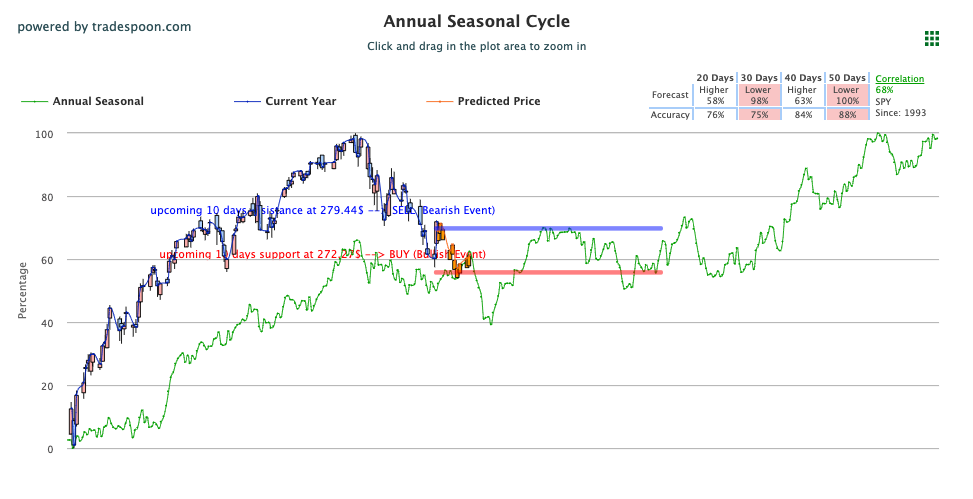
Market rallied above 200 days MA at $278
After hints that interest rates can be lower this year, market rallied above 200 days MA at $278- gauged by the SPY ETF. We expect the market to continue trading between $280-$294 for the SPY, with the ETF currently trading below its 50-days moving average of $286.
We encourage our readers to avoid chasing the market near $290 but consider buying near $280. However, if the SPY breaks it current support at $272, we expect the market to continue its sell off to $262 level in the next 30-60 days. Expect market volatility to persists as long as SPY below $286 level.
For reference, the SPY Seasonal Chart is shown below:
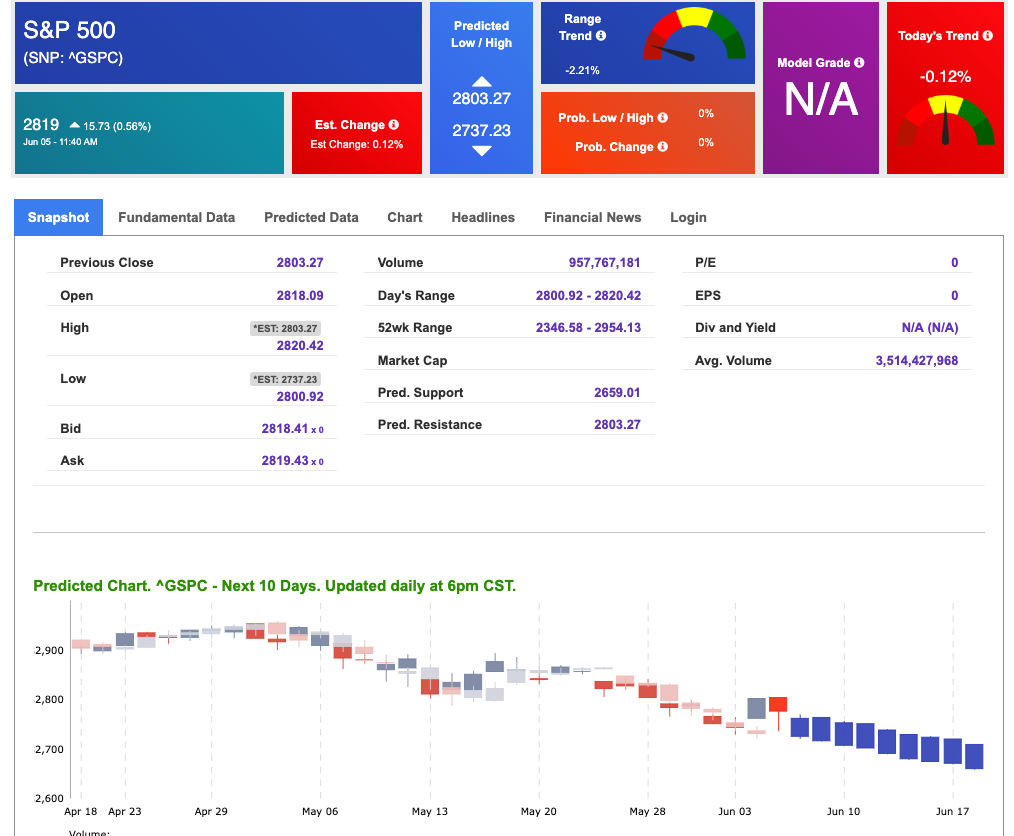
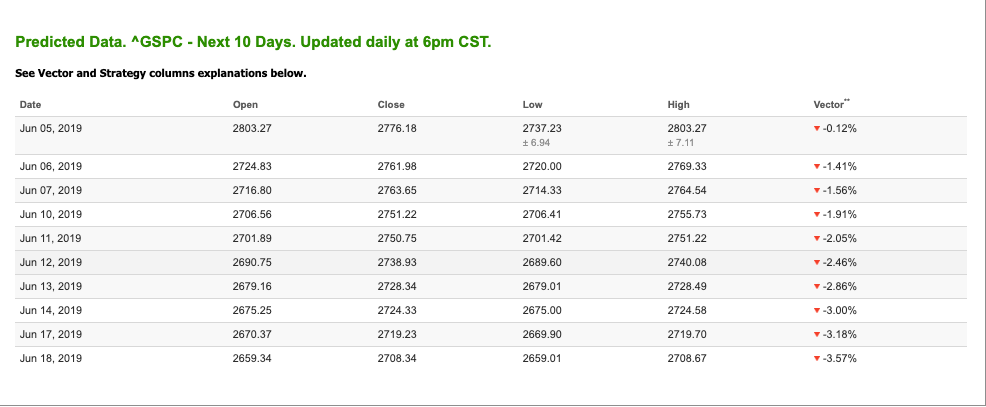
Using the “^GSPC” symbol to analyze the S&P 500, our 10-day prediction window shows near-term negative signals. Today’s vector figure of +0.12% registers as neutral and the average vector weighting for the 10-day forecast is strong to the downside. At the time of publication, the index is trading above today’s predicted high of 2,803.27 at 2819, an indicator of the whipsaw effect of recent news. Prediction data is uploaded after the market close at 6pm, CST. Today’s data is based on market signals from the previous trading session.
Make more money during market turnaround…
74.7% Success Rate!
Actual Returns… 1244.2%!
Even in this wild UP and down market, you can do it too.
This no-risk trial will empower you with the same incredible volatility tested “tools” I use to trade my own money!
Click Here to Learn More
Highlight of a Recent Winning Trade
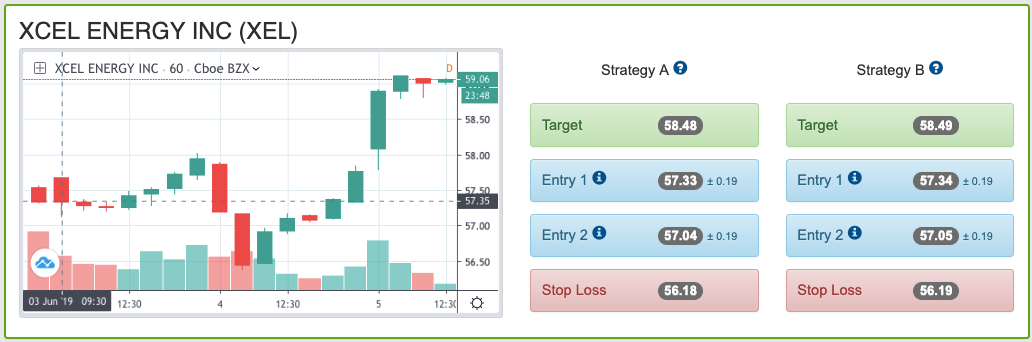
On June 3rd, our WeeklyTrader service produced a bullish recommendation for the Xcel Energy Inc. (XEL). WeeklyTrader is available as a standalone subscription service or included in Tradespoon’s Elite Trading Circle membership plan. WeeklyTrader is designed for 2-5 day positions for stocks and single options.
Trade Breakdown
XEL entered its forecasted Strategy B Entry 1 price range of $57.34 (± 0.19) in the first hour of trading on Monday, 6/03 and hit its Target price of $58.49 on Wednesday, 6/05. The Stop Loss price was set at $56.19.
Thursday Morning Featured Symbol
*Please note: Our featured stock is part of your free subscription service. It is not included in any paid Tradespoon subscription service. Vlad Karpel only trades his own personal money in paid subscription services. If you are a paid subscriber, please review your Premium Member Picks, ActiveTrader or MonthlyTrader recommendations. If you are interested in receiving Vlad’s personal picks, please click here.
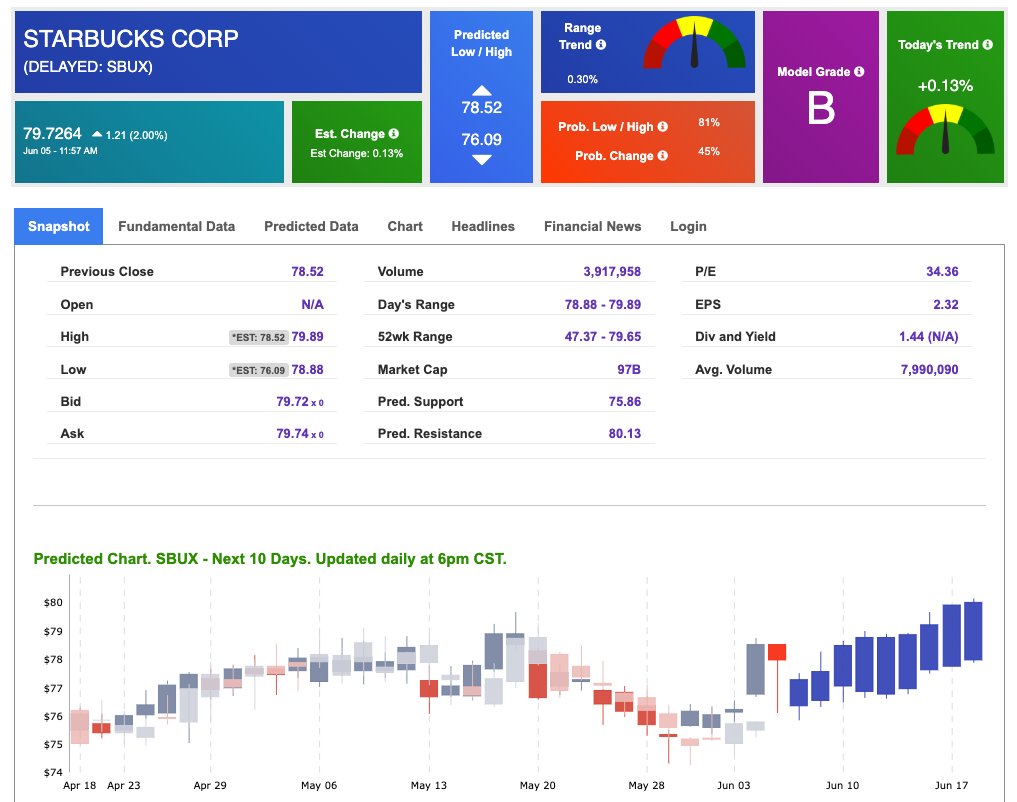
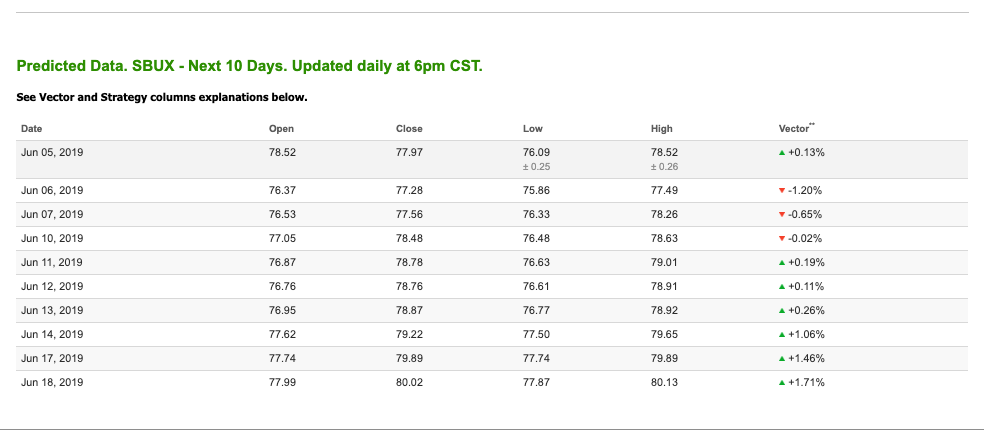
Our featured symbol for Thursday is Starbucks Corp. (SBUX). SBUX is showing positive outlook in our Stock Forecast Toolbox’s current-day prediction. This stock is assigned a Model Grade of (B) indicating it ranks in the top 25th percentile for accuracy for current-day predicted support and resistance, relative to our entire data universe. The stock has broken its predicted current-day resistance, and has out-performed the market with a 2.00% gain at the time of publication. The 10-day prediction was created Tuesday after market close, and will update tonight with revised figures for the near-term. Stay tuned for more direction in our next Market Commentary issue as this symbol will be sensitive to changing news and developments.
The stock is trading at $79.73 at the time of publication, up 2.00% from the open with a +0.13% vector figure.
Prediction data is uploaded after market close at 6 p.m., CST. Today’s data is based on market signals from the previous trading session.
Note: The Vector column calculates the change of the Forecasted Average Price for the next trading session relative to the average of actual prices for the last trading session. The column shows expected average price movement “Up or Down”, in percent. Trend traders should trade along the predicted direction of the Vector. The higher the value of the Vector the higher its momentum.
Oil
A huge surge in U.S. crude supplies drove down oil futures today, putting them on track to bear-market levels. Compounding the downward pressure are unabated worries about economic slowdown- which can hurt demand for oil. The Energy Information Administration reported a U.S. crude supply rise of 6.8 million barrels for the week ended May 31. Analysts expected a drop of 1.7 million barrels. EIA numbers also showed gasoline inventories soaring by 3.2 million barrels against expectations of an increase of only 208,000 barrels. Distillate stockpiles grew by 4.6 million barrels against an expected drop of 1.08 million barrels.
West Texas Intermediate for July delivery (CLN19) is priced at $51.53 per barrel, down 3.66% from the open, at the time of publication.
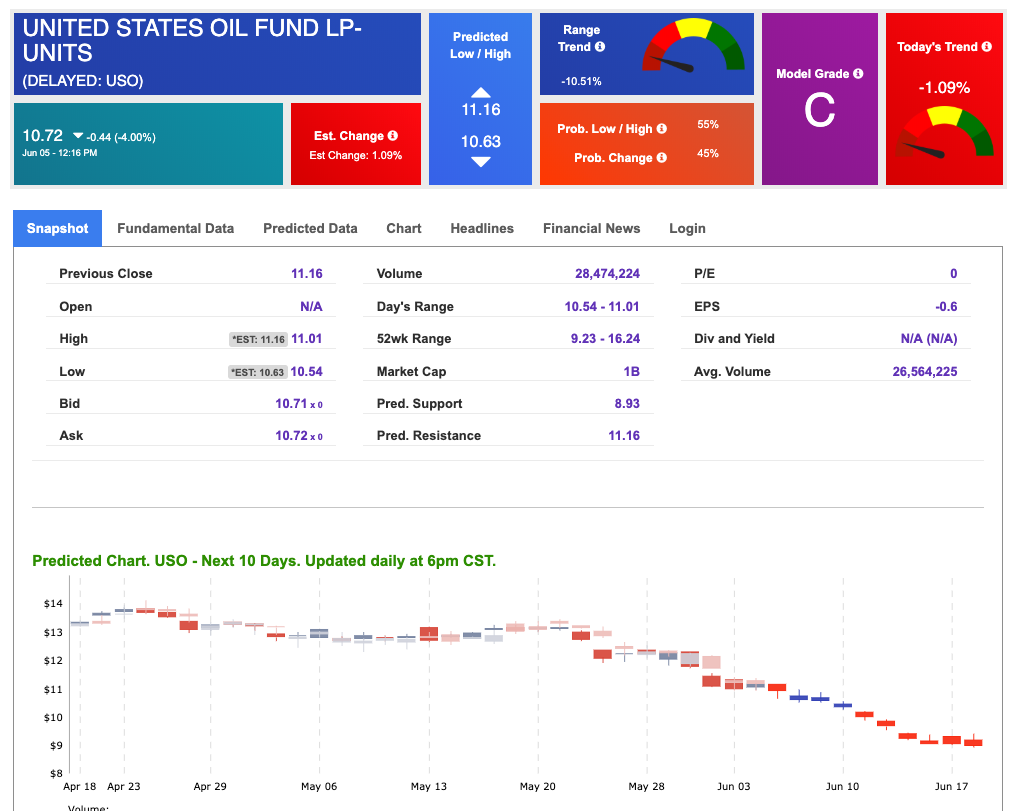
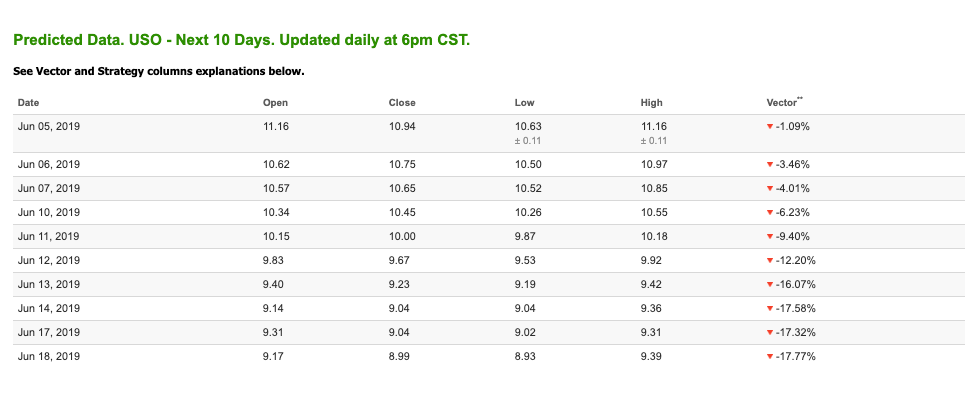
Looking at USO, a crude oil tracker, our 10-day prediction model shows a strong near-term bearish outlook. The fund is trading at $10.72 at the time of publication, down 4.00% from the open. Vector figures show -1.09% today and continue a negative momentum trend in the near-term. Prediction data is uploaded after market close at 6 p.m., CST. Today’s data is based on market signals from the previous trading session.
(Want free training resources? Check our our training section for videos and tips!)
Gold
Gold futures rallied today against a backdrop of weak economic data, continued trade disputes and Fed commentary and is looking at its sixth consecutive gain. It would signal the longest streak since January 2018.
The price for August gold (GCM19) is up 0.41% at $1,332.50 at the time of publication.
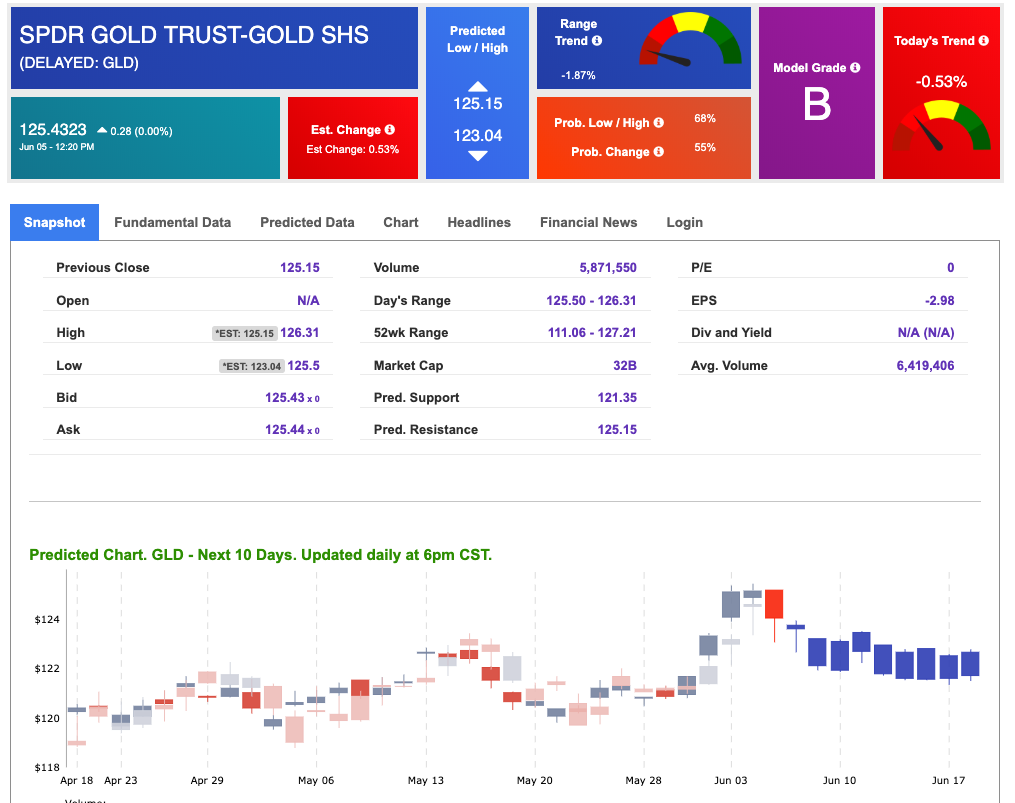
Using SPDR GOLD TRUST (GLD) as a tracker in our Stock Forecast Tool, the 10-day prediction window shows bearish vector signals- reflected by the Range Trend meter. The gold proxy is trading at $125.43, up 0.23% at the time of publication. Vector signals show -0.53% for today- which registers as a slightly bearish signal. The ETF has broken its predicted resistance today, which is an influence indicator of recent news developments. Prediction data is uploaded after market close at 6 p.m., CST. Today’s data is based on market signals from the previous trading session.
(Want free training resources? Check our our training section for videos and tips!)

Treasuries
Yields mostly pushing down today as reactions settle from Fed commentary around interest-rate policy and the U.S. economic outlook. The deep inversion of the yield-curve is still intact, with the 3-month bill and the 10-year note yield gap maintaining a negative 25-basis point gap. The yield on the 10-year Treasury note is down 0.45% at 2.13% at the time of publication. The yield on the 30-year Treasury note is mostly unchanged at 2.63% at the time of publication.
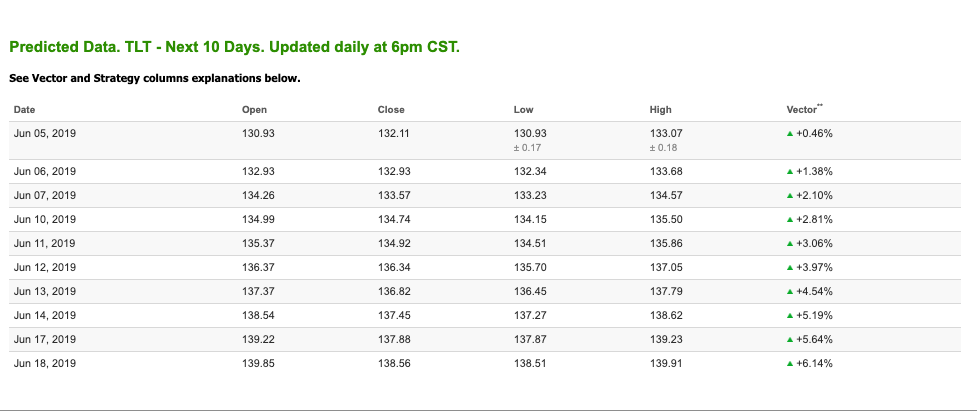
Using the iShares 20+ Year Treasury Bond ETF (TLT) as a proxy for long-dated bond prices in our Stock Forecast Tool, we see strong positive near-term signals. Today’s vector of +0.46% registers as neutral/positive and incrementally grows each day in the forecast- which is a strong bull signal. Investors should keep tabs on headlines and changes in bond buying and selling activity as new economic data is released. Prediction data is uploaded after market close at 6 p.m., CST. Today’s data is based on market signals from the previous trading session.
(Want free training resources? Check our our training section for videos and tips!)

Volatility
The Volatility Index is decreasing today, trending more toward its 52-week low of $10.17, relative to its 52-week high of $36.20.
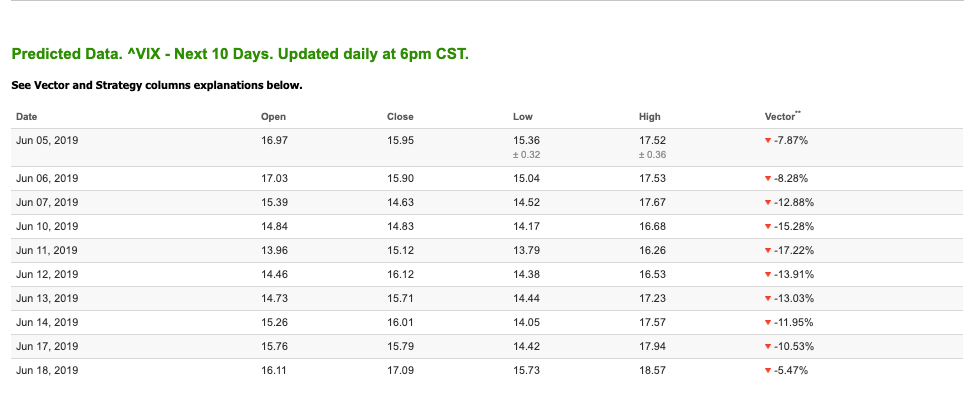
The CBOE Volatility Index (^VIX) is down 2.36% at $16.57 at the time of publication, and our 10-day prediction window shows a negative near-term outlook. The predicted low/high for today is 15.36 and 17.52 with a vector of -7.87%. Prediction data is uploaded after market close at 6 p.m., CST. Today’s data is based on market signals from the previous trading session.
(Want free training resources? Check our our training section for videos and tips!)

Make more money during market turnaround…
74.7% Success Rate!
Actual Returns… 1244.2%!
Even in this wild UP and down market, you can do it too.
This no-risk trial will empower you with the same incredible volatility tested “tools” I use to trade my own money!