S&P Books Second-Highest Finish Ever, Strong Earnings Support U.S. Markets
Focus shifts to retail, energy, and oil
U.S. Benchmarks, for the most part, closed higher on Monday to kick off May, with the S&P booking record gains as it records its second-highest close ever. The Nasdaq was the sole index to finish in the red, closing down 0.48%, as investors continue to parse through corporate earnings, Fed, and COVID data. Last week major-tech dominated earnings talk while this week’s focus shifts to retail, energy, and oil; key economic reports to release this week include March trade deficit and factory orders, April employment report, and Q1 productive and unit labor costs
. Chain supply disruption and shortages are on the minds of investors with the latest manufacturing reports sparking some alarm. Gold and oil futures continue to trade higher as the dollar dipped today. Globally, Asian markets traded lower while European markets, supported by the latest proposal to lighten COVID travel restrictions, traded unanimously higher.
Our models are projecting the SPY to trade in the range of $385-$420 for the next 6 weeks, following the latest rebound and slowing momentum behind treasury and currency markets. The $SPY has reached our target of $415-$420 based on the 6-month forecast from our Stock Forecast Toolbox and we encourage readers to raise cash at this point. While the DXY sold off and the TLT continues to trade in the range, the SPY broke above the $400 level across all asset classes. We encourage all market commentary readers to maintain clearly defined stop levels for all positions. For reference, the SPY Seasonal Chart is shown below:
Key U.S. Economic Reports/Events This Week:
- Trade Deficit (March) – Tuesday
- Factory Orders (March) – Tuesday
- ADP Employment Report (April) – Wednesday
- Markit Services PMI (April) – Wednesday
- ISM Services Index (April) – Wednesday
- Weekly Jobless Claims (4/24) – Thursday
- Productivity (Q1) – Thursday
- Unit Labor Costs (Q1) – Thursday
- Unemployment Rate (April) – Friday
- Nonfarm Payrolls (April) – Friday
- Average Hourly Earnings (April) – Friday
- Wholesale Inventories (March) – Friday
- Consumer Credit (March) – Friday
Upcoming Earnings:
- L – Loew’s – Monday
- ATVI – Activision Blizzard – Tuesday
- CVS – CVS Health – Tuesday
- D – Dominion Energy – Tuesday
- DD – DuPont – Tuesday
- H – Hyatt Hotels – Tuesday
- LYFT – Lyft – Tuesday
- MPC – Marathon Petroleum – Tuesday
- PFE – Pfizer – Tuesday
- TMUS – T-Mobile – Tuesday
- ZG – Zillow – Tuesday
- UAA – Under Armour – Tuesday
- ETSY – Etsy – Wednesday
- FOX – Fox Corp. – Wednesday
- GDDY – GoDaddy – Wednesday
- GM – General Motors – Wednesday
- HLT – Hilton Worldwide – Wednesday
- MRO – Marathon Oil – Wednesday
- PYPL – PayPal – Wednesday
- UBER – Uber – Wednesday
- AMC – AMC Entertainment Holdings – Thursday
- ALL – Allstate – Thursday
- CAH – Cardinal Health – Thursday
- DBX – Dropbox – Thursday
- GRPN – Groupon – Thursday
- K – Kellogg – Thursday
- MRNA – Moderna – Thursday
- NRG – NRG Energy – Thursday
- PTON – Pelton Interactive – Thursday
- PENN – Penn National Gaming – Thursday
- SQ – Square – Thursday
- VIAC – ViacomCBS – Thursday
- W – Wayfair – Thursday
- YELP – Yelp – Thursday
- DKNG – DraftKings – Friday
For reference, the S&P 10-Day Forecast is shown below:

Using the “^GSPC” symbol to analyze the S&P 500 our 10-day prediction window shows a near-term mixed outlook. Prediction data is uploaded after the market closes at 6 p.m. CST. Today’s data is based on market signals from the previous trading session.

Vlad’s Portfolio Lifetime Membership!
DO AS I DO… AS I DO IT WATCH LIVE AS I WORK THE MARKETS! TRY IT NOW RISK-FREE!
Click Here to Sign Up
Tuesday Morning Featured Symbol

Our featured symbol for Tuesday is Alphabet Inc (GOOGL). GOOGL is showing a steady vector in our Stock Forecast Toolbox’s 10-day forecast.

The stock is trading at $2343.08 with a vector of -0.13% at the time of publication.
10-Day Prediction data is uploaded after the market close at 6 p.m., CST. Today’s data is based on market signals from the previous trading session.

Note: The Vector column calculates the change of the Forecasted Average Price for the next trading session relative to the average of actual prices for the last trading session. The column shows the expected average price movement “Up or Down”, in percent. Trend traders should trade along the predicted direction of the Vector. The higher the value of the Vector the higher its momentum.
*Please note: At the time of publication Vlad Karpel does have a position in the featured symbol, GOOGL. Our featured symbol is part of your free subscription service. It is not included in any paid Tradespoon subscription service. Vlad Karpel only trades his money in paid subscription services. If you are a paid subscriber, please review your Premium Member Picks, ActiveTrader, or MonthlyTrader recommendations. If you are interested in receiving Vlad’s picks, please click here.
Oil
West Texas Intermediate for Crude Oil delivery (CL.1) is priced at $64.50 per barrel, up 1.45% at the time of publication.
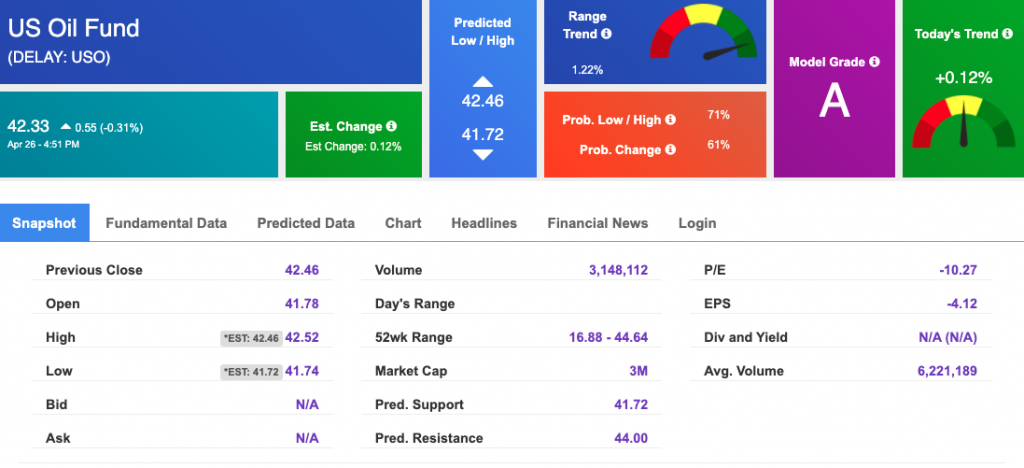
Looking at USO, a crude oil tracker, our 10-day prediction model shows positive signals. The fund is trading at $42.33 at the time of publication. Prediction data is uploaded after the market close at 6 p.m., CST. Today’s data is based on market signals from the previous trading session.
Gold
The price for the Gold Continuous Contract (GC00) is up 1.44% at $1793.20 at the time of publication.
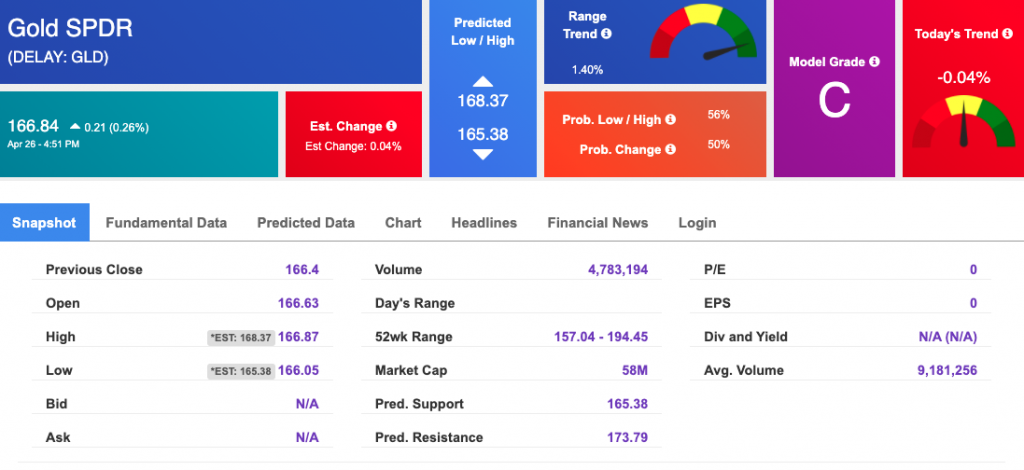
Using SPDR GOLD TRUST (GLD) as a tracker in our Stock Forecast Tool, the 10-day prediction window shows mixed signals. The gold proxy is trading at $166.84 at the time of publication. Vector signals show -0.04% for today. Prediction data is uploaded after the market close at 6 p.m., CST. Today’s data is based on market signals from the previous trading session.
Treasuries
The yield on the 10-year Treasury note is up, at 1.603% at the time of publication.
The yield on the 30-year Treasury note is up, at 2.300% at the time of publication.
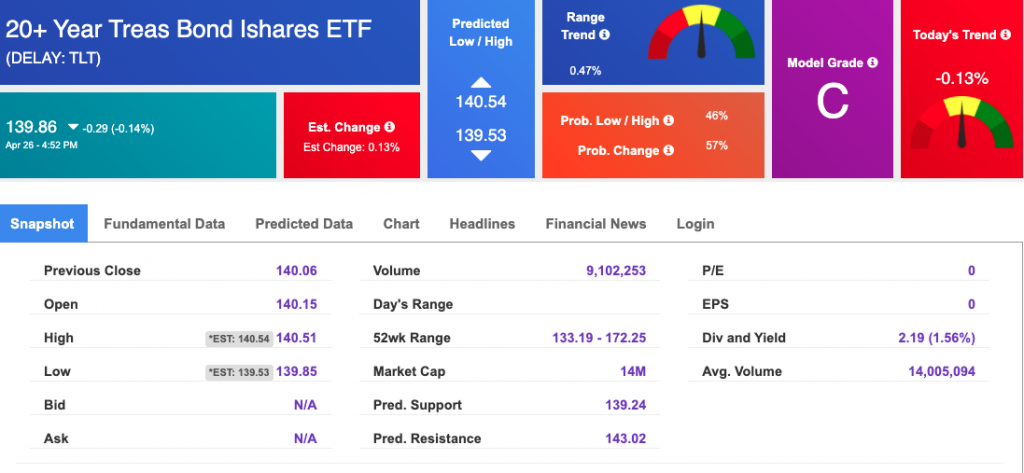
Using the iShares 20+ Year Treasury Bond ETF (TLT) as a proxy for bond prices in our Stock Forecast Tool, we see mixed signals in our 10-day prediction window. Prediction data is uploaded after the market close at 6 p.m., CST. Today’s data is based on market signals from the previous trading session.
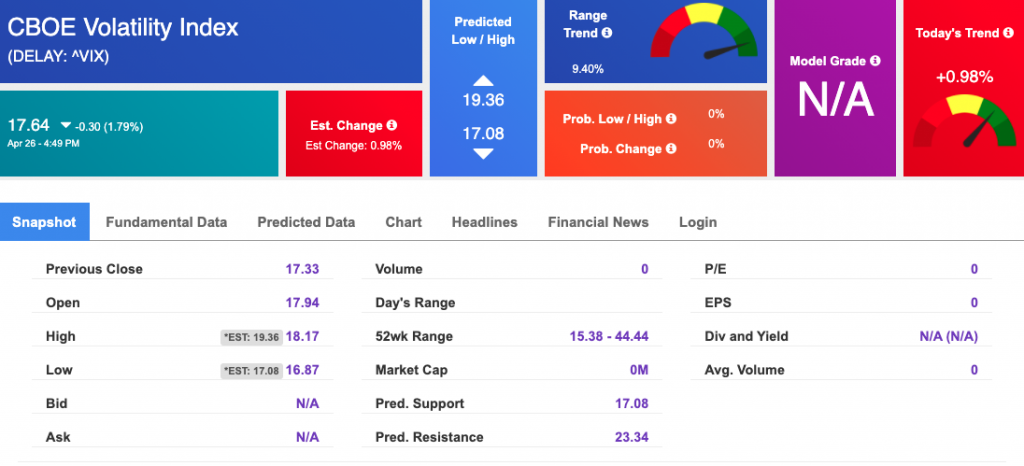
Volatility
The CBOE Volatility Index (^VIX) is $17.64 at the time of publication, and our 10-day prediction window shows negative signals. Prediction data is uploaded after the market close at 6 p.m., CST. Today’s data is based on market signals from the previous trading session.