
Markets Near Record High, U.S.-China Roll Back Tariffs
U.S. and China to scale back tariffs in phases
All three major U.S. indices are nearing record highs after news that both the U.S. and China would scale back tariffs in phases, ahead of the December signing of “phase one” of the trade deal. With both sides looking to continue negotiations, the latest development to cancel certain tariffs has been positively received by global markets; Asian and European markets have also closed in the green. Today’s headline earnings report will come from Disney after the market closes, along with data from Activision Blizzard, Booking Holdings, and Zillow.
(Want free training resources? Check our our training section for videos and tips!)
Buy when the SPY is near $297
We will look to buy when the SPY is near $297 and continue following the semiconductor sector as we approach a strong seasonal trend. Having just recently broken through the 52 weeks high for the SPY, overhead resistance sits near the $310 level and there is little evidence the market will retest its 200 days MA. Further volatility is expected and we expect shallow pullbacks. We recommend readers maintain clearly defined stop levels for all positions. For reference, the SPY Seasonal Chart is shown below:

Canceling certain tariffs positively received by both U.S. and Chinese markets
The latest development in the U.S.-China “phase one” deal looks to phase out and eventually cancel certain tariffs between both sides, if the deal is successfully signed. This development was positively received by both U.S. and Chinese markets as they are set to unanimously close in the green.
ECB forecasts continued positive economic growth through the end of 2019
A new venue for the next round of talks is still not set but with both sides eager to hash out “phase one” of the deal, some progress is certainly due before the year’s end. Also supporting global markets is the latest report from the European Central Bank which forecasts continued positive economic growth through the end of 2019.
With only a few key earnings left, third-quarter earnings season has thus far been a successful one with most companies in the S&P reporting above expectations. Today’s major report will release after the market closes as Disney is set to release Q3 data. The media and entertainment conglomerate is looking at some major changes in 2019 after it acquired Fox and is also scheduled to debut its very own streaming platform, Disney+. Qualcomm Inc. reported after the market close on Wednesday and saw shares up 6% today. Expedia Group and AMC Entertainment saw shares dip following their Q3 reports while Cardinal Health Inc. saw over 3% gains following their report topped expectations. Looking ahead, earnings season winds down next week with a lighter load of data, which will include Walmart, Cisco Systems, Applied Materials, Cronos Group, Tilray, and Viacom reports.
(Want free training resources? Check our our training section for videos and tips!)


Using the “^GSPC” symbol to analyze the S&P 500 our 10-day prediction window shows positive signals. Today’s vector figure of +0.08% moves to +1.54% in five trading sessions. Prediction data is uploaded after the market closes at 6 p.m. CST. Today’s data is based on market signals from the previous trading session.
Lifetime Premium Service
Sign up now for Lifetime Access and pay less than the cost of just 1 year to lock-in …
No-Questions-Asked “You Can’t Lose”30 Day Money Back Guarantee
We make money in every market.
Don’t miss our next big trade!
Click here to learn more and check on availability
Highlight of a Recent Winning Trade
On October 31st, our ActiveTrader service produced a bullish recommendation for Illinois Tool Works Inc. (ITW). ActiveTrader is included in all paid Tradespoon membership plans and is designed for day trading. Signals are meant to last for 1-2 days as long as vector confirms the same direction as the original pick
Trade Breakdown
ITW entered its forecasted Strategy B Entry 1 price range $170.21 (± 1.03) in its first hour of trading the following trading day (11/1/19) and passed through its Target price of $171.91 in the first hour of trading the next day (11/2/19). The Stop Loss price was set at $168.51.

Friday Morning Featured Symbol
*Please note: At the time of publication we do own the featured symbol, LLY. Our featured symbol is part of your free subscription service. It is not included in any paid Tradespoon subscription service. Vlad Karpel only trades his own personal money in paid subscription services. If you are a paid subscriber, please review your Premium Member Picks, ActiveTrader or MonthlyTrader recommendations. If you are interested in receiving Vlad’s personal picks, please click here.

Our featured symbol for Friday is Eli Lilly and Company (LLY). LLY is showing a confident vector trend in our Stock Forecast Toolbox’s 10-day forecast. This stock is assigned a Model Grade of (A) indicating it ranks in the top 10th percentile for accuracy for predicted support and resistance, relative to our entire data universe.

The stock is trading at $112.64 at the time of publication, down 1.04% from the open with a +0.65% vector figure.
Prediction data is uploaded after the market close at 6 p.m., CST. Today’s data is based on market signals from the previous trading session.
Note: The Vector column calculates the change of the Forecasted Average Price for the next trading session relative to the average of actual prices for the last trading session. The column shows the expected average price movement “Up or Down”, in percent. Trend traders should trade along the predicted direction of the Vector. The higher the value of the Vector the higher its momentum.
Oil
West Texas Intermediate for Crude Oil delivery (CL.1) is priced at $57.36 per barrel, up 1.81% from the open, at the time of publication.
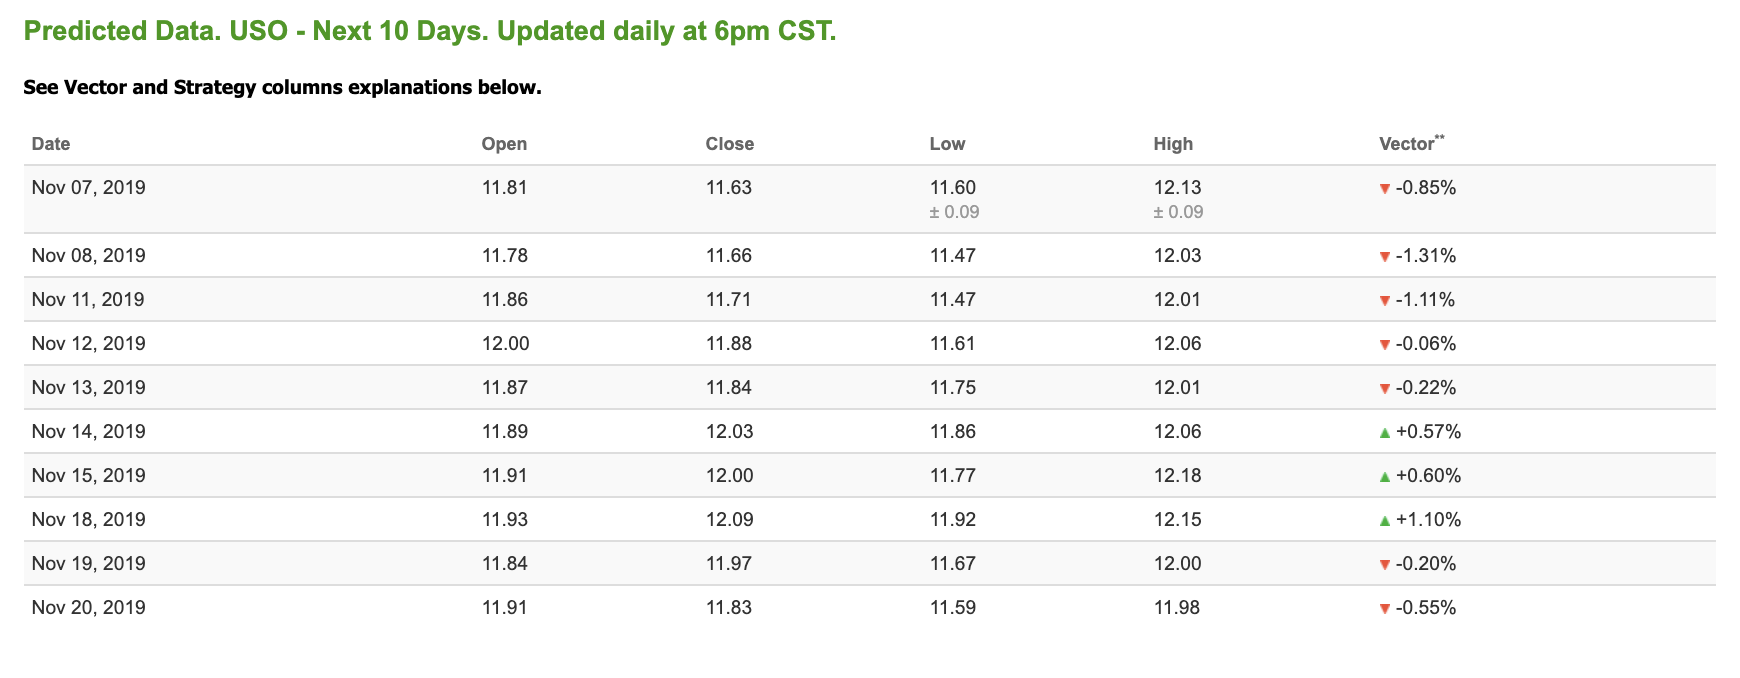
Looking at USO, a crude oil tracker, our 10-day prediction model shows mixed signals. The fund is trading at $12.02 at the time of publication, down 1.78% from the open. Vector figures show -0.85% today, which turns +0.57% in five trading sessions. Prediction data is uploaded after the market close at 6 p.m., CST. Today’s data is based on market signals from the previous trading session.

Gold
The price for the Gold Continuous Contract (GC00) is down 1.83% at $1,465.80 at the time of publication.
Using SPDR GOLD TRUST (GLD) as a tracker in our Stock Forecast Tool, the 10-day prediction window shows positive signals. The gold proxy is trading at $137.97, down 1.77% at the time of publication. Vector signals show +0.37% for today. Prediction data is uploaded after the market close at 6 p.m., CST. Today’s data is based on market signals from the previous trading session.


Treasuries
The yield on the 10-year Treasury note is up 7.04% at 1.92% at the time of publication. The yield on the 30-year Treasury note is up 4.23% at 2.40% at the time of publication.
Using the iShares 20+ Year Treasury Bond ETF (TLT) as a proxy for bond prices in our Stock Forecast Tool, we see mixed signals in our 10-day prediction window. Today’s vector of +0.53% moves to +1.24% in three sessions. Prediction data is uploaded after the market close at 6 p.m., CST. Today’s data is based on market signals from the previous trading session.


Volatility
The CBOE Volatility Index (^VIX) is down 0.71% at $12.53 at the time of publication, and our 10-day prediction window shows mixed signals. The predicted close for tomorrow is $13.23 with a vector of +1.57%. Prediction data is uploaded after the market close at 6 p.m., CST. Today’s data is based on market signals from the previous trading session.
(Want free training resources? Check our our training section for videos and tips!)

