
Latest Beige Book Highlights Slowing Economy and Inflation Concerns
For the third straight session, U.S. markets unanimously closed in the red on Wednesday. All three major U.S. indices traded lower in the shortened trade week as strong economic reports are not able to support markets at the moment. Concern regarding the Federal Reserve easing monetary programs and the inflation/Treasury implications are weighing markets as the latest labor data returned strong following a mostly upbeat earnings season. Last week, U.S. markets traded to mixed results with the S&P and Nasdaq closing further into record territory.
The latest federal Beige Book was released today, highlighting a slowed moderate economic growth throughout the last few months as several sectors saw potential impact from the delta variant. Additional revelations in the Beige Book included a slowdown in dining and entertainment sectors, several supply shortages, and an elevated page of growing inflation. COVID infection rates continue to influence markets as rates climb both in the U.S. and globally due to the delta variants of the virus. Developments in the coming weeks regarding the Middle East, vaccination rates, and any Fed response to the latest labor and economic data could potentially impact markets.
VIX at the $18 level
The volatility index (VIX) is at the $18 level behind key market drivers: the current earnings season and the bond market. With Fed reassurance of transitory inflation pushing markets’ to the upside, we recommend watching the critical support levels on the SPY at $445 and $440. We are still expecting a short-term correction to continue in the next two weeks.
Additional market movers include COVID infection rates, Hurricane Ida’s impact, and global response to the tension in the Middle East. Key U.S. economic reports released this week will include monthly employment, payroll, and unemployment rate. Globally, Asian and European markets closed to mixed results. We encourage all market commentary readers to maintain clearly defined stop levels for all positions. For reference, the SPY Seasonal Chart is shown below:
Key U.S. Economic Reports/Events This Week:
- Beige Book – Wednesday
- Job Openings (July) – Wednesday
- Consumer Credit (July) – Wednesday
- Weekly Jobless Claims (9/4) – Thursday
- Producer Price Index (August) – Thursday
- Wholesale Inventories (July) – Friday skhool
‘If you’re looking for free trading resources… click here’
For reference, the S&P 10-Day Forecast is shown below:

Using the “^GSPC” symbol to analyze the S&P 500 our 10-day prediction window shows a near-term mixed outlook. Prediction data uploaded after the market closes at 6 p.m. CST. Today’s data is based on market signals from the previous trading session.

Vlad’s Portfolio Lifetime Membership!
DO AS I DO… AS I DO IT WATCH LIVE AS I WORK THE MARKETS! TRY IT NOW RISK-FREE!
Click Here to Sign Up
Thursday Morning Featured Symbol

Our featured symbol for Thursday is Amazon.com (AMZN). AMZN is showing a steady vector in our Stock Forecast Toolbox’s 10-day forecast.

The stock is trading at $3525.5 with a vector of +0.97% at the time of publication.
10-Day Prediction data uploaded after the market close at 6 p.m., CST. Today’s data is based on market signals from the previous trading session.

Note: The Vector column calculates the change of the Forecasted Average Price for the next trading session relative to the average of actual prices for the last trading session. The column shows the expected average price movement “Up or Down”, in percent. Trend traders should trade along the predicted direction of the Vector. The higher the value of the Vector the higher its momentum.
*Please note: At the time of publication Vlad Karpel does have a position in the featured symbol, AMZN. Our featured symbol is part of your free subscription service. Not included in any paid Tradespoon subscription service. Vlad Karpel only trades his money in paid subscription services. If you are a paid subscriber, please review your Premium Member Picks, ActiveTrader, or MonthlyTrader recommendations. If you are interested in receiving Vlad’s picks, please click here.
Oil
West Texas Intermediate for Crude Oil delivery (CL.1) is priced at $69.39 per barrel, up 1.52% at the time of publication.

Looking at USO, a crude oil tracker, our 10-day prediction model shows mixed signals. The fund is trading at $48.59 at the time of publication. Prediction data uploaded after the market close at 6 p.m., CST. Today’s data is based on market signals from the previous trading session.
Gold
The price for the Gold Continuous Contract (GC00) is down 0.43% at $1790.70 at the time of publication.
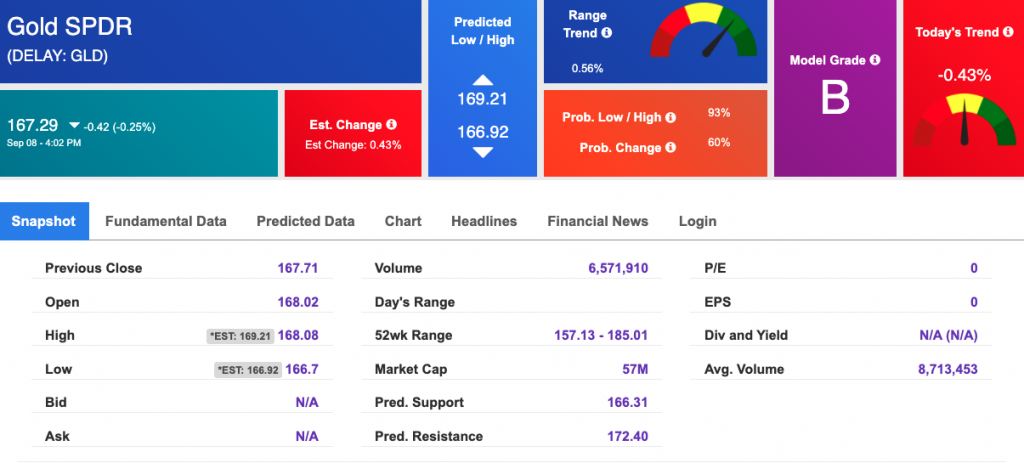
Using SPDR GOLD TRUST (GLD) as a tracker in our Stock Forecast Tool, the 10-day prediction window shows negative signals. The gold proxy is trading at $167.29 at the time of publication. Vector signals show -0.43% for today. Prediction data uploaded after the market close at 6 p.m., CST. Today’s data is based on market signals from the previous trading session.
Treasuries
The yield on the 10-year Treasury note is down, at 1.344% at the time of publication.
The yield on the 30-year Treasury note is down, at 1.961% at the time of publication.

Using the iShares 20+ Year Treasury Bond ETF (TLT) as a proxy for bond prices in our Stock Forecast Tool, we see mixed signals in our 10-day prediction window. Prediction data uploaded after the market close at 6 p.m., CST. Today’s data is based on market signals from the previous trading session.
Volatility
The CBOE Volatility Index (^VIX) is $17.96 at the time of publication, and our 10-day prediction window shows mixed signals. Prediction data uploaded after the market close at 6 p.m., CST. Today’s data is based on market signals from the previous trading session.
