
Examining Tesla’s Option Activity
On numerous occasions, I’ve written about the options trading surge creating a new set of market dynamics. Overall, options volume has surged 85% over the past 18 months with the trading bulk being individual names vs index-based ETFs. Let’s drill down into how this is impacting day-to-day trading and leading to a volatility increase.
[$19 Blowout Sale] Access the top-secret trading techniques you need to profit in Options Trading.
In August, I noted how options volume surged past equity volume which, in turn, means the notional value. Remember: Each options contract represents 10x (100 shares) of the underlying; this means the options notional values are now about 250% of total equity value. And, most of this is coming from retail traders buying short-term out-of-the-money calls, or what’s been referred to as a “YOLO trade” in individual names.
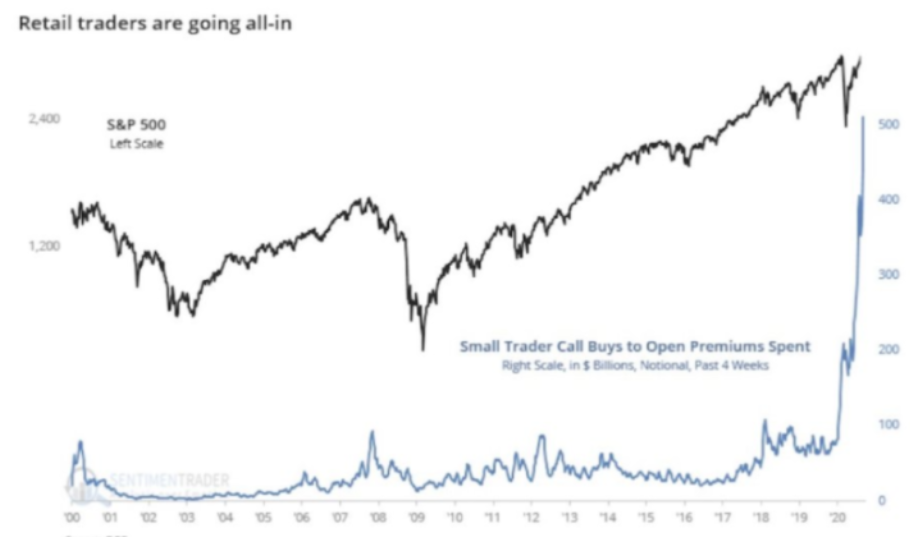
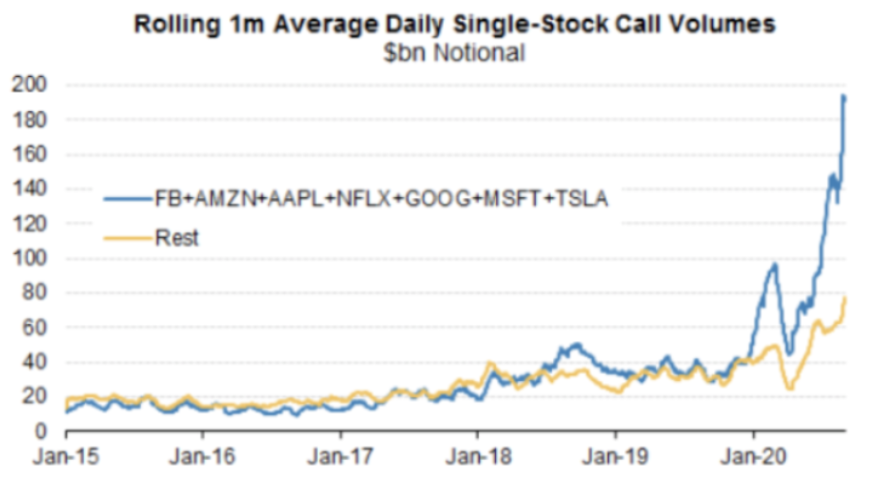
While meme stocks get their share of headlines and trading activity, the big-cap tech stocks or FATMNG (or whatever the current acronym is), have garnered the majority of activity. Meaning, professional traders and hedge funds have also joined the party. But, big funds come with a mindset of how to drive short-term price movement rather than some YOLO or “apes stand together mentality.”
Options volume in single stocks has exceeded the SPDR S&P 500 and Power Shares Nasdaq 100 unheard of just 2 years ago
Indeed, in the past three months, options volume in single stocks has exceeded the SPDR S&P 500 (SPDR) and Power Shares Nasdaq 100 (QQQ) which would have been unheard of just 2 years ago. This had led to a “gamma squeezes” and parabolic moves phenomenon.
In Tuesday’s article, I wrote: “One item concerning me is how the VIX has climbed 5 of the last 6 days; even as stocks moved higher. I will dive deeper into this tomorrow. But, this is a reminder that the VIX, often referred to as “fear index,” is actually directionally agnostic. In other words, a sharp move higher, coupled with a recent penchant for massive call buying of out-of-the-money call options can cause a lift in the VIX.”
Tesla (TSLA) is exhibit A of how options activity’s becoming the tail that wags the dog. Let’s take a look at TSLA’s recent stock price and options activity.
Back on October 25, Hertz (HTZ) announced a “deal” or more accurately, a commitment to buy some 100,000 TSLA vehicles over the next 2-3 years. This translates into about $4 billion of committed sales. However, TSLA stock surged over 12%, adding over $100 billion to its market cap.
How does an intention to $4 billion product translate into being valued as worth 240% above said sales?
It can partly be explained by some fundamental, or at least sentiment in that if a large car rental company deems TSLA, or other EVs, worth adding to its fleet validates the shift to EVs as a major macro trend. There’s also a small flywheel or marketing aspect, those that rent a TSLA may soon become a buyer.
But. the real juice for the stock surge came from option activity. On October 26, options volume and notional value in TSLA surpassed the next 12 names combined– this includes behemoths like Amazon (AMZN) and Apple (AAPL) along with the SPY. All told, investors spent $5.11 billion on call options, compared with a total of $279 million on puts; an 18:1 ratio.”Simply amazing.”

Purchasing $20 billion-plus of in-the-money puts out in the 2024 expiration
The next notable options activity occurred this past money after Musk ran a Twitter (TWTR) poll deciding if he should sell 10% of his shares. He made it sound like he’d likely need to sell some $15 billion in stock to cover an upcoming tax event was of secondary importance.
But, some big players took that as a sign to hedge their holding via purchasing $20 billion-plus of in-the-money puts out in the 2024 expiration.

This large amount of money for put buying contributed a gamma squeeze on the downside with TSLA shares sliding some 17% over the next few days before finding a bottom at $1,000 this morning.
This chart shows those dates and key levels that triggered an option volume surge.
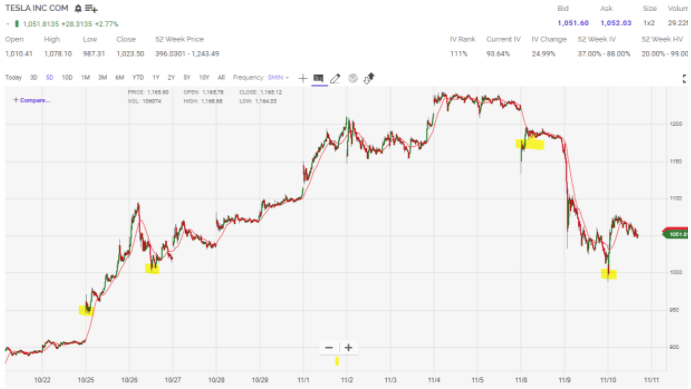
As you can see, this morning turned into a huge reversal; the stock opened down some 3% near $1,000 on the notion that funds would need to shed some TSLA to raise cash to be allocated into the Rivian (RIVN) IPO.
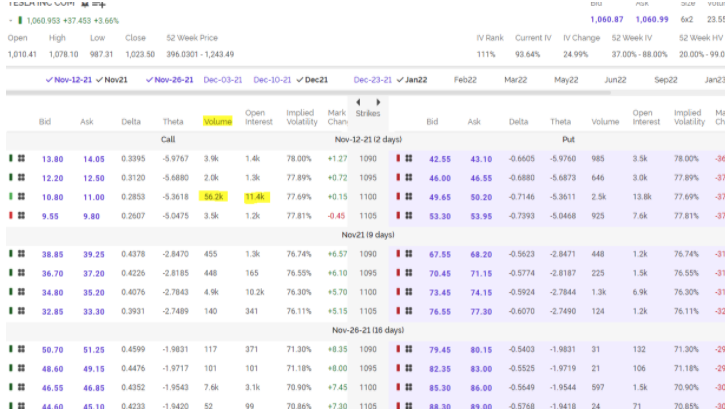
However, then call buyers came in force. Right out of the gate, the 1100 strike calls — which expire this Friday — saw massive buying. By midday, 55,000-plus contracts had traded versus open interest of just 11,400 contracts. You can see on the option chain that this far outstrips volume in any other strike; the only one to surpass current open interest by a large margin.
The gamma squeeze on with shares quickly reversed. Additionally, TSLA shares hit an intraday high of $1078.
I haven’t traded TSLA since 2017 when I shorted it around $270 a share (pre-split!). And, it has remained on my “no trade” list ever since. But, it provides a great illustration of the new market dynamics where options lead the action. It’s something we all need to be aware of as it helps explain day-to-day price movement better than past headlines. Or the mainstream media’s narrative.
The post Examining Tesla’s Option Activity appeared first on Option Sensei.